
How We Grade a Season
Every year, someone asks who the best player in the WNBA is, and every year, everyone answers with vibes. We built a formula instead. It does not care about vibes. It cares about six numbers, and it will tell you, with complete confidence, exactly how good you are relative to everyone else who plays your sport this season.
We take six stats and rank every qualifying player (minimum 5 games played) against the rest of their league on each one — not against last year's league, not against a Hall-of-Fame prime, against the people they actually played this season. That rank becomes a score from 0 (dead last) to 100 (best in the league at that specific thing).
Then we add the six scores together and scale the whole league against whoever has the best total. The single best composite season gets a 100 — an A+ — and everyone else is graded relative to them. Most "report card" stats just average the six scores and grade the average, which lets one bad category sink an otherwise elite season into C-minus territory. We are not naming names. It was Caitlin Clark. Everyone knows it was Caitlin Clark.
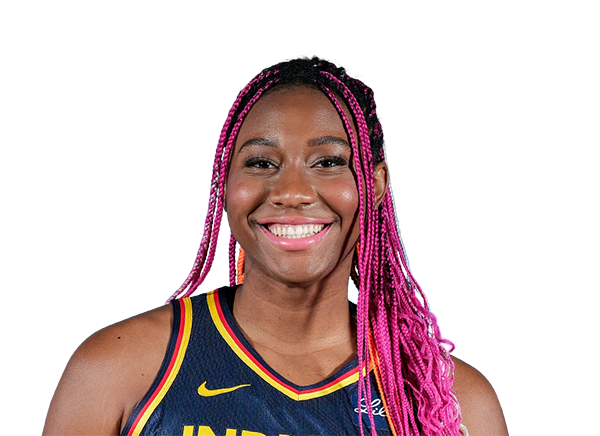
Spotlight: Caitlin Clark vs. Angel Reese
The public's pick for the league's best two, with their actual league-wide rank and numbers — same six-stat grading as everyone below.
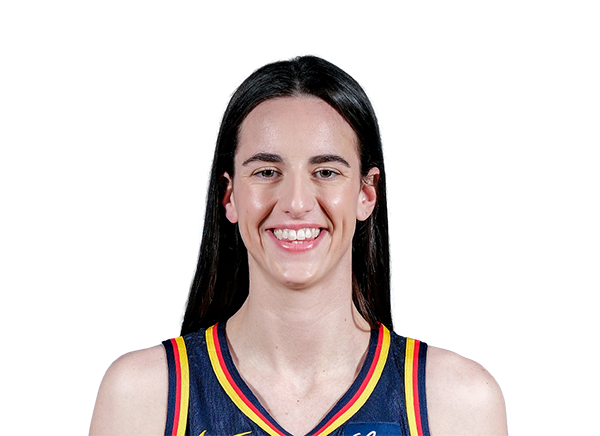

A 100th-percentile Playmaking season -- the single best passer in the league by this measure -- sitting right next to a 0 in Ball Security, the single worst turnover rate in the league by this measure. Both of those are true about the same player in the same season, which is either a beautiful contradiction or just what happens when you attempt more passes than anyone alive. Still an 89, a B+. The formula noticed the 8.4 assists a night. It also noticed the 4.7 turnovers. On balance, it has decided this is a net positive.


A 100th-percentile Rebounding season on 12.2 boards a night -- the single best rebounding number in this entire report, top 10 included. Her Shooting percentile, a 37, is by a wide margin her softest number, which the model dutifully counted against her, on the grounds that it does not know an offensive rebound is basically a second shot attempt and is, frankly, being a little unfair about it. Lands at an 85 anyway. The model has feelings about efficiency. It does not have feelings about effort.
The Top 10, By League Grade


A 100 out of 100, which under this system means she is, mathematically, the best player in the league. We want to be clear this was not a subjective call -- we do not have opinions, we have a PERCENT_RANK() function, and it does not care about your feelings, or apparently Ball Security, where she sits in the 11th percentile. The one blemish on an otherwise flawless report card, like finding out your smartest friend still can't parallel park.
A 96, which is a very polite thing for the second-best player in the league to do -- not push for the 100, just quietly post a 99th-percentile Defense season and let the math sort out the rest. There is no committee. There was never a committee.
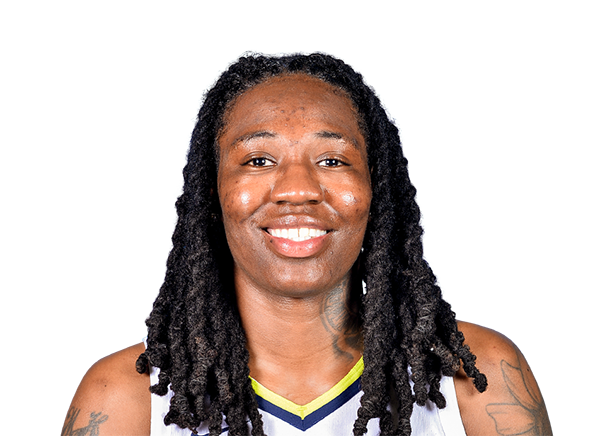

Not a single category below the 80s. That's the statistical equivalent of a report card with no C's on it -- deeply impressive, and also the kind of thing that makes other, perfectly good report cards look bad by comparison, which frankly isn't fair to the other report cards.
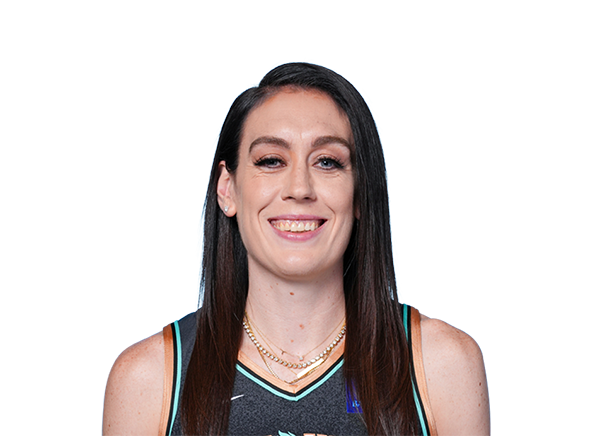

A 97th-percentile Scoring season paired with a 62nd-percentile Shooting one, which is the analytics version of being extremely good at ordering food and merely fine at eating it. Still lands a 95. The model noticed the volume. The model was not impressed by the volume alone. The model has standards, and by 'the model' we mean six numbers added together.
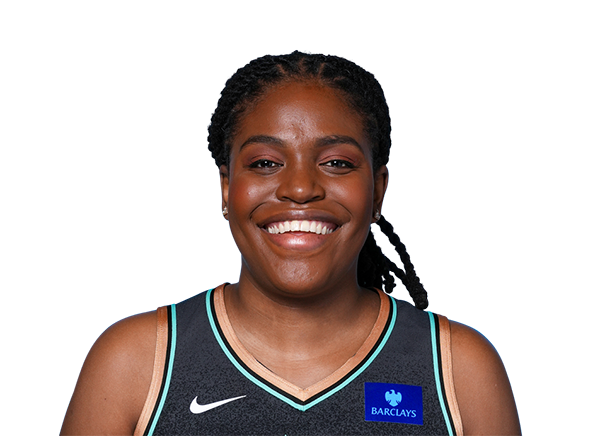
A 90th-percentile Shooting season stacked on an 82nd-percentile Defense one, which add up, if you do the math, to a very good basketball player. We are told there is a version of sports writing that does not simply repeat the word 'good.' We have not located it.
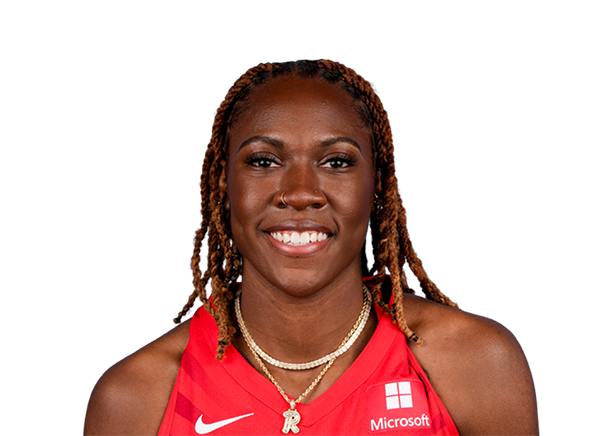
Hit the 100th percentile in Defense, tied for the league lead, at a position where 'good defense' is often just a polite phrase for 'stood near someone convincingly.' Her softest number is Rebounding at a 74 -- still better than most people's entire personality.
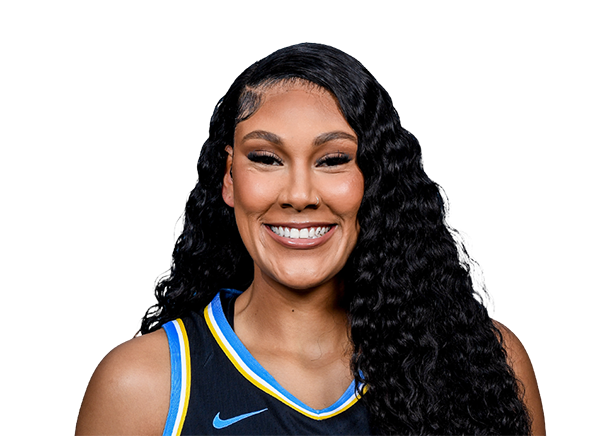

A 92nd-percentile Defense season and a 93 overall, achieved without a single hot take being written about her -- which, respectfully, should be everyone's actual goal.
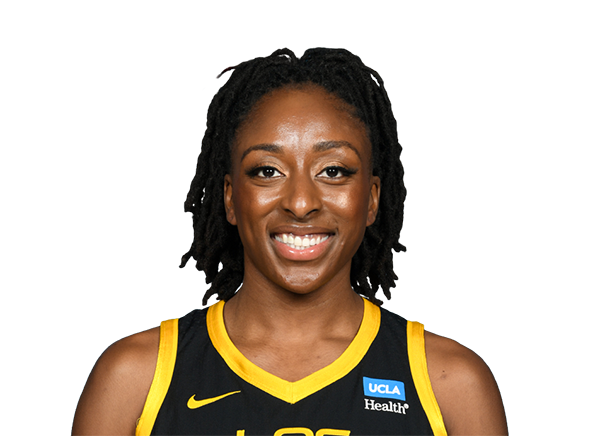

Her weakest category is Defense at a 72nd percentile, which on this particular curve is the equivalent of getting a B- on a test everyone else failed. Finishes at a 93 anyway -- extremely good at basketball, only pretty good at basketball, if that distinction means anything. It does not, really.

The best Playmaking percentile in this top 10, a 97, sitting directly next to the worst Ball Security in it, a 2 -- the statistical signature of throwing genuinely incredible passes, a few of which found the other team. Still finishes at a 93. The formula forgives. The formula, unlike your coach, has moved on.
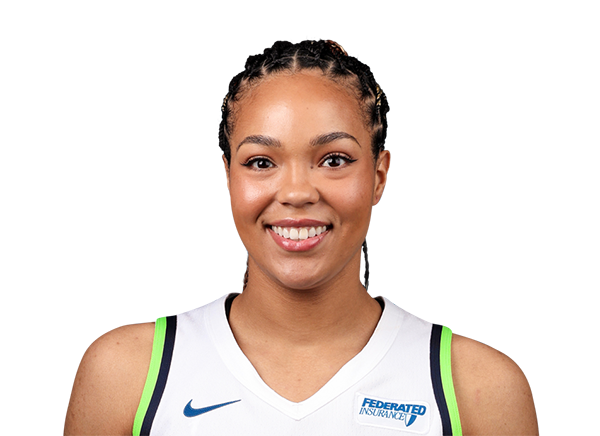
Makes the top 10 on 13 games played, which is either an outrageous hot streak or proof our 5-game qualifying minimum is doing exactly what it's supposed to. Either way: a 93. The formula does not print asterisks. It is possible it should.