

The Formula's Opening Statement
Both semifinal leaders got there the same way, and it isn't star power. Atlanta is up 1-0 on New York behind the best defense and the best rebounding percentile left in the bracket. Golden State is up 1-0 on Las Vegas with a flatly absurd profile: 100th percentile defense, 100th percentile net rating, 100th percentile ball security, and 21st percentile shooting, dead last among the four teams standing. The formula does not care that this is the least star-driven Final Four the league could have produced. It has noticed that the two teams controlling the glass and taking care of the ball are also the two teams up 1-0.
New York beat the No. 1 seed Minnesota Lynx to get here. Las Vegas needed three games to get past Indiana. Both wins are real. Neither changes what the regular-season data says is each team's actual weak point, and both of those weak points are about to get tested again tonight.
Semifinal: Atlanta vs. New York, By Percentile
Each dot is where that team ranked among all 15 WNBA teams this season. Farther from the center line is better. Atlanta's case is defense and the glass. New York's is shooting efficiency, and everything else is a question mark.
Semifinal: Golden State vs. Las Vegas, By Percentile
Las Vegas wins the shooting and offense categories by a wide margin. Golden State wins literally everything else, including a perfect 100th-percentile mark in defense, net rating, and ball security.
Shape of the ATL–NY Series
Atlanta's hexagon is almost a full circle. New York's is a spike on one axis, shooting, and nearly collapsed on ball security.
Shape of the GS–LV Series
Golden State's shape is defense-and-discipline. Las Vegas's is an offensive spike with almost no rebounding presence at all.
Where the Final Four Lived All Season
Every gray dot is a WNBA team. The upper-right quadrant combines above-average offense with above-average defense, the two-way space the best teams occupy. Golden State is the extreme defensive outlier of the whole league; Las Vegas is the extreme offensive one. Atlanta and New York both sit closer to the middle, which is exactly why their series is tighter.
Driving point: Golden State's defensive rating of 96.7 isn't just good for the final four. It's the best mark in the 15-team league by a comfortable margin. Las Vegas's 112.0 offensive rating is the inverse story on the other end of the court.
The Regular Season Was Not a Straight Line
Rolling five-game net rating shows form, not just the final average. All four teams had a rough patch in midsummer. Atlanta and Las Vegas are the two still trending up entering the playoffs; New York and Golden State both cooled before their net rating steadied.
Driving point: Atlanta's +26.0 five-game spike late in the data is the hottest closing kick of any of the four teams, consistent with a 9-1 record in their last 10 regular-season games.
Four Players Who Decide These Series
These are 2026 regular-season per-game numbers, not Staaty projections dressed up as certainty. The strength-and-weakness argument stays attached to real production.


Reese's strength is the single biggest individual mismatch left in the bracket: a 12.0-rebound anchor against a New York frontcourt (64th percentile rebounding) that already leans hardest on Jonquel Jones alone. Her weakness is efficiency: a .523 true shooting mark is the softest number on Atlanta's roster, so the Dream win this matchup on volume and positioning, not touch. Source


Wilson is the best individual player remaining in the playoffs, full stop: 25.8 points on 62.2% true shooting carrying a 32.6% usage rate. Her weakness isn't her own box score, it's her supporting cast: Las Vegas's team rebounding percentile is 21st out of 15 teams, dead last of the final four, which means a deep, disciplined Golden State frontcourt can crash the glass around her without needing to stop her one-on-one. Source

Canada is the mechanism behind Atlanta's best number: an 86th-percentile ball-security team built on point-of-attack pressure. New York's ball-security percentile is 36th, the single worst category of any team left standing, with a 15.2% turnover rate to match. That is the exact seam Canada and Atlanta's guards are already attacking. Source
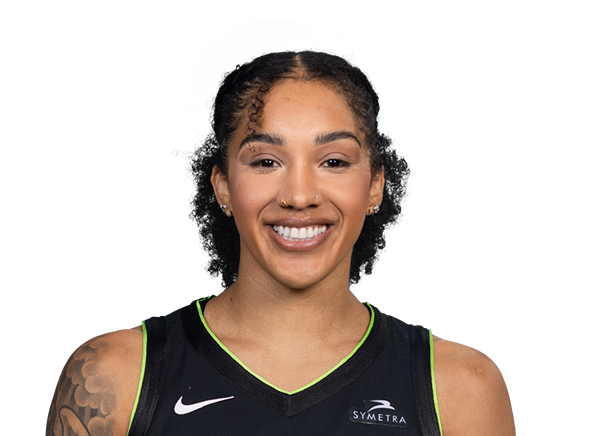

Williams is the clearest face of Golden State's identity: no 20-point scorer anywhere on the roster, but the league's best defense and a bench that outscores most teams' starters (35.3 bench points per game, tops in the WNBA). Her own weakness, a modest .506 true shooting mark, barely matters when the team's whole plan is to slow the game down and let the other side's stars work for everything. Source
How Each Series Actually Gets Decided
Make the Liberty handle the ball against pressure. New York's offense is efficient in a phone booth (79th-percentile shooting) but turns it over more than any team left in the bracket. Force extra possessions and Atlanta's rebounding and defense do the rest.
Slow it down and crash the glass. Las Vegas scores at will when the game is fast; Golden State's whole roster is built to make it slow, physical, and about 15 possessions shorter than Las Vegas wants, while out-rebounding a frontcourt that ranks 21st in the league on the boards.
The Projection
Early lean: Atlanta Dream vs. Golden State Valkyries in the 2026 WNBA Finals. Both are up 1-0 for the same underlying reason: elite defense and elite care of the ball, not a signature go-to scorer. If that lean holds, it would be the first Finals in recent memory built entirely around two-way depth instead of a marquee individual matchup.
The cleanest flip signal in either series is turnovers. New York and Las Vegas both have a real path back into this if they clean up the exact category, ball security and rebounding, where the data says they're most exposed. The formula isn't rooting for a boring Finals. It just hasn't found a reason yet to pick against the two teams that don't turn the ball over and don't get out-rebounded.
Method & Sources
Staaty data covers 2026 WNBA regular-season team and player averages, standings, percentile ranks among all 15 teams, rolling net rating, and the 2026 postseason bracket through October 7. Percentiles are calculated league-wide; defensive and turnover measures are inverted so a higher percentile is always better. Series records and schedule reflect completed games through the morning of October 7, 2026; both semifinals were 1-0 with Game 2 of each series played that evening.
Player and team images are delivered by ESPN's and the WNBA's public image services. Box-score references: WNBA.com/stats.