
The Argument Everyone Is Having Wrong
Every rivalry this loud eventually produces the same tired question: who's the GOAT? We don't have a good answer to that, and neither does anyone shouting about it on television, because "greatest" isn't a stat, it's a vibe wearing a stat's clothes. What we do have is a formula — six categories, percentile-ranked against every other player in the league this season, added up and scaled against the best composite season anyone put together. It does not know these two are on magazine covers. It does not know they sell out road arenas. It knows Scoring, Shooting, Playmaking, Rebounding, Defense, and Ball Security, and it is prepared to discuss exactly those six things and nothing else, forever, with the emotional range of a spreadsheet.
So here's the honest version of this story: the 2026 WNBA regular season is over. Clark finished the No. 18-graded player in the league. Reese finished No. 31. Neither of them cracked the top 12 you're about to see below, which will surprise exactly no one who has watched either of their turnover totals, and infuriate everyone who hasn't. This is what actually happened, six numbers at a time.
The Top 12, By League Grade — And Where Clark and Reese Actually Rank
Minimum 5 games played, final 2026 WNBA regular season. Neither Clark nor Reese appears here — that's not an oversight, that's the whole plot. A'ja Wilson posted the only 100 in the league; Clark and Reese posted a combined zero Ball Security percentile between them and still both finished with a grade better than a full third of the league.
For reference: Clark's 89 would have tied for 4th on this list. Reese's 85 would have tied for 9th. Both are comfortably above the qualifying-player median — they just happen to be the two most argued-about players attached to the two most argued-about weaknesses in the entire league.
Clark and Reese, Plotted Against Each Other
Six-category percentile radar, same formula as the top 12 above. The bigger the shape, the more of the league a player is beating in that category. These two shapes barely overlap, which is the actual rivalry — not who's better, but how differently two players can both be historically great.

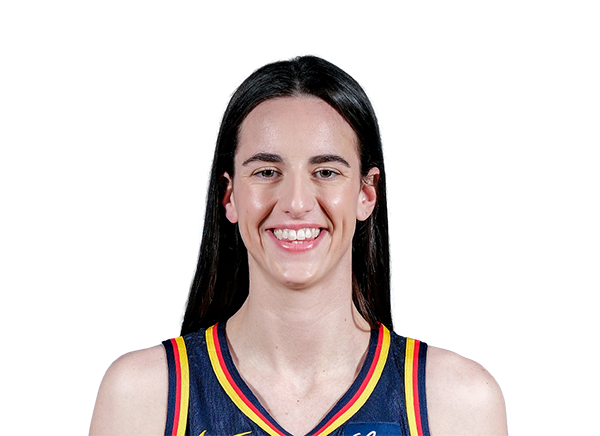
A 99th-percentile Scoring season stapled to a 100th-percentile Playmaking one — the single best passer in the league by this measure, again — sitting directly next to a flat 0 in Ball Security, the single worst turnover rate in the WNBA. Both of those are true about the same player in the same season, which the model has decided, for the second year running, is on balance a net positive: an 89, a B+. It noticed the 8.4 assists a night. It also noticed the 4.7 turnovers a night, filed a complaint, and moved on anyway.

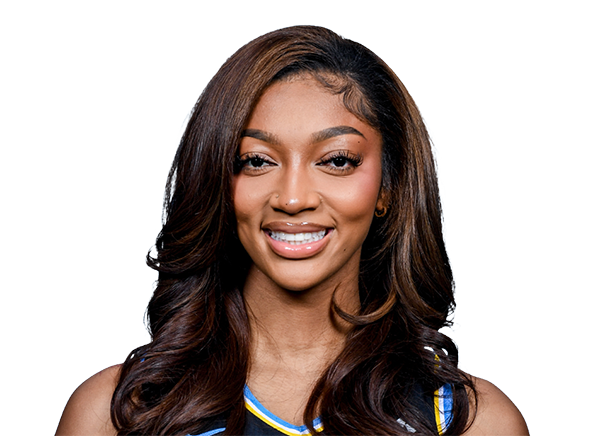
A 100th-percentile Rebounding season on 12.2 boards a night, plus a 97th-percentile Defense mark — the best rebounder and one of the best defenders in the league, full stop, on the same roster spot. Her Shooting percentile, a 37, is the softest number anywhere near this report, and the model dutifully counted it against her on the grounds that it does not officially know a second-chance possession is basically a free shot attempt, and is, respectfully, being a little unfair about that. An 85, a B, anyway.
The Actual Stat Line, Side by Side
Same six categories as the radar above, but now positioned by where each stat actually ranks against the rest of the WNBA, with the real per-game number sitting above each dot. Clark is running the highest-usage offense in the league through her hands; Reese is doing the possession math — extra shots, extra stops — underneath the rim. Two completely different jobs, both done at an elite level, on teams that finished the season with the identical 27-14 record.
Every Game, Not Just the Average
A season average flattens the season. Clark's 22.5 PPG includes a 45-point night in Chicago on July 17 and a 6-point outing on May 30 — the same player, five weeks apart. Reese's 16.0 PPG includes a 31-point game on August 22 and, on July 25, a scoreless zero. Neither of them is a metronome, and the formula's season-long percentiles don't show that. This does.
Who Was Actually Shooting the Ball Well, and When
Rolling 5-game field-goal percentage, pulled directly from every game log — this is the trend the season average hides. Both players finished the year hot: Clark shot 45.3% from the field for the full season but closed at a 49.5% rolling clip; Reese shot 44.5% for the season and closed at 54.2%. Both are finishing meaningfully better than their own full-season number.
The read: Clark spent most of the season shooting in the low-to-mid 40s and finished on a real heater; Reese's shot has been below 45% for long stretches and finished the season noticeably hotter than her overall 52.1% true-shooting mark would suggest. Both trend lines end well above where they started — if the playoffs are a continuation of September, not May, that matters more than either player's full-season average.
Fever vs. Dream: The Teams Are the Players, Scaled Up
This is the part that should embarrass anyone who's tried to have this argument without a spreadsheet: run the same four-factors math on Indiana and Atlanta as teams, and you get Clark and Reese's exact individual profiles, just with fourteen more players attached. The Fever led the entire 15-team league in offensive rating and effective field-goal percentage — and ranked 10th in defensive rating. The Dream led the league in offensive rebound rate and ranked top-4 in defense — and ranked 11th in shooting. Nobody built these rosters to make a point. The formula found the point anyway.
Where Every Team Actually Lived
Every gray dot is one of the 15 real 2026 WNBA franchises (two exhibition-only All-Star rosters excluded). The Fever bought their offense with defense; the Dream bought their defense with offense. Neither trade is free, and the formula does not offer refunds.
About That Playoff Matchup You're Hoping For
It doesn't happen in Round 1. Indiana (the No. 3 seed) opens against Las Vegas and A'ja Wilson's 100-graded season. Atlanta (the No. 4 seed) opens against Washington. Best-of-three, both series, starting Sept. 27. If you want Clark and Reese on the same floor in a game that counts, you need both the Fever and the Dream to survive two separate best-of-five gauntlets first — the bracket has opinions about your storylines, and it does not care what ESPN wants to promote.
The Verdict, Such As It Is
Clark's 89 beats Reese's 85. That's the whole ranking, and it's closer than four years of internet arguing would suggest. It is not a GOAT verdict, because "GOAT" isn't in the six categories and we are not going to invent a seventh one just to settle a Twitter fight. What the formula will say, under oath, is this: Clark is running the highest-graded offensive engine attached to a below-average defense in the league; Reese is running one of the most dominant two-way interior seasons in the league attached to the shakiest jumper among anyone this good. Both of those are elite players. Neither of those is a finished argument. Good — rivalries that get settled stop being rivalries.
Method & Sources
League grade methodology: six per-player percentiles (Scoring, Shooting via true shooting %, Playmaking, Rebounding, Defense via steals + blocks, and inverted Ball Security via turnovers) ranked against every qualifying 2026 WNBA player (minimum 5 games), summed, and scaled against the league's best composite season. Team figures use the same 15-franchise, final-regular-season data (two All-Star exhibition rosters excluded from every ranking). Player and team pages: Caitlin Clark, Angel Reese, Indiana Fever, Atlanta Dream. Data current through the final day of the 2026 WNBA regular season, September 24, 2026.